Environment monitoring
In this lab you will learn how to install, setup and launch IBM Cloud Observability tools, to monitor your applications deployed on an IBM Cloud Kubernetes cluster
Connect to a logging service
-
On the cluster overview page, connect your cluster with a logging service through the tile called “Integrations”
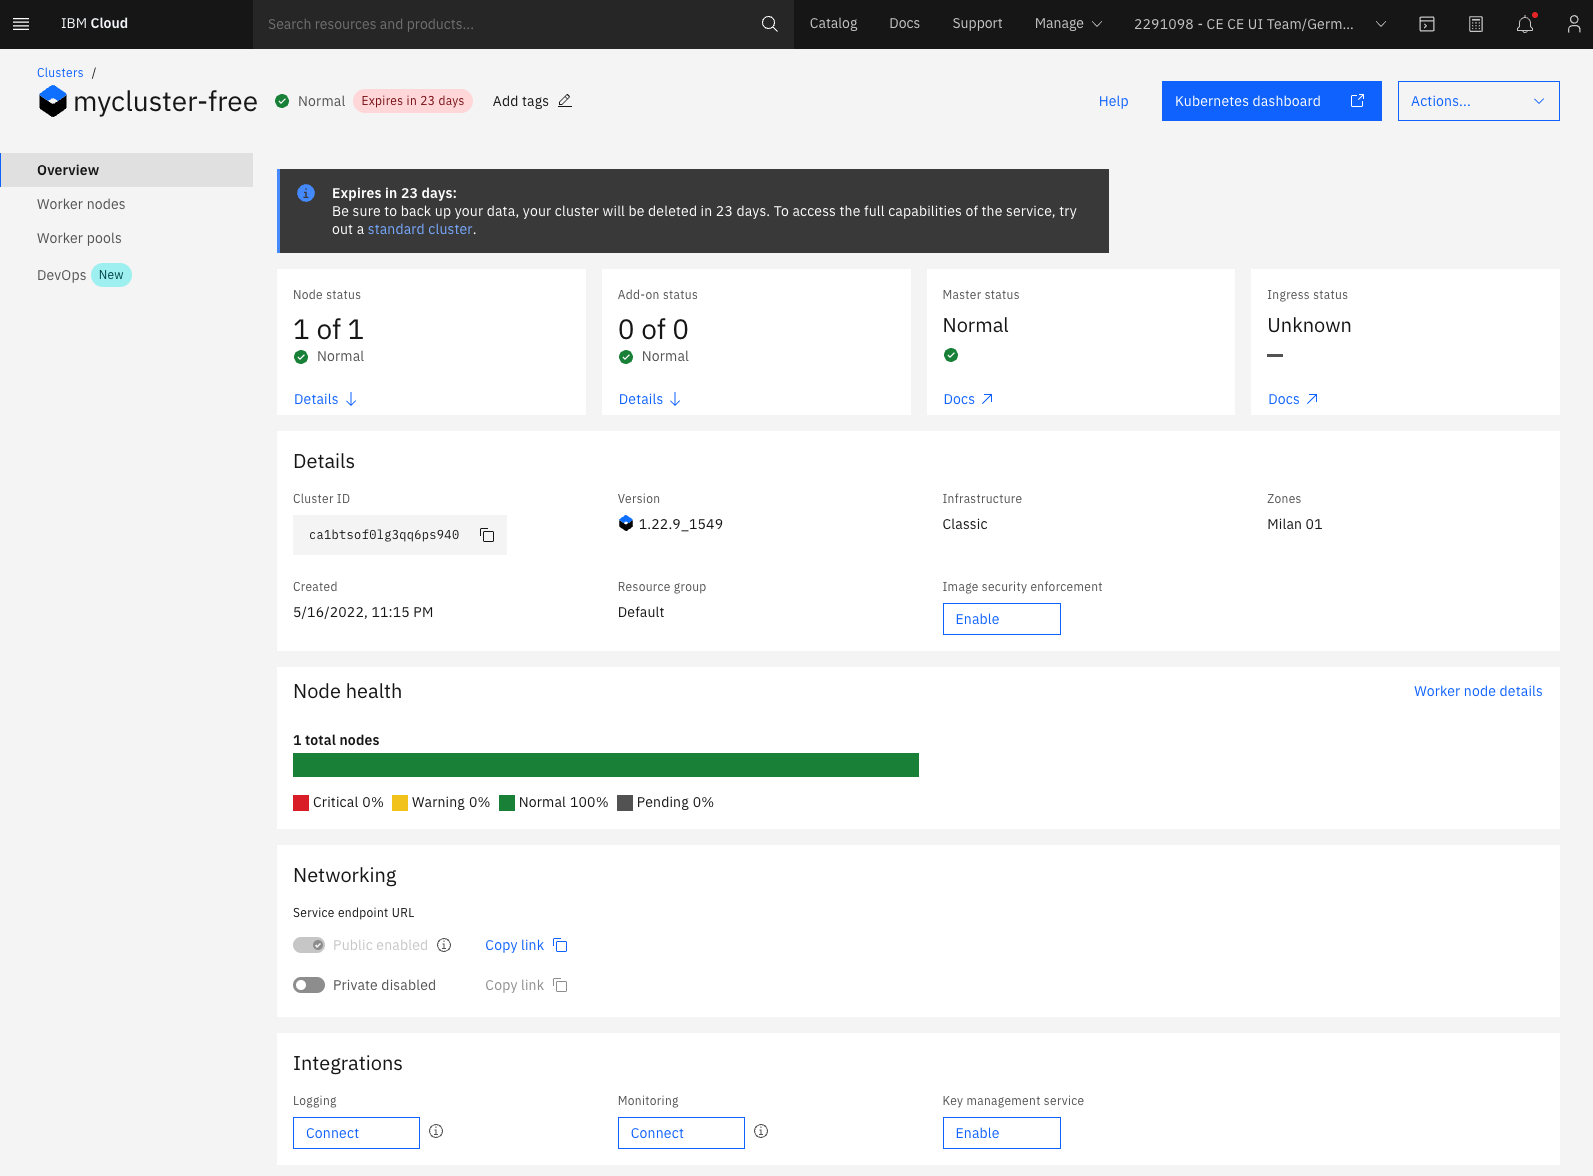
-
Create a new logging service instance in Frankfurt using the Free plan
-
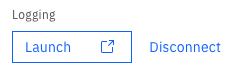
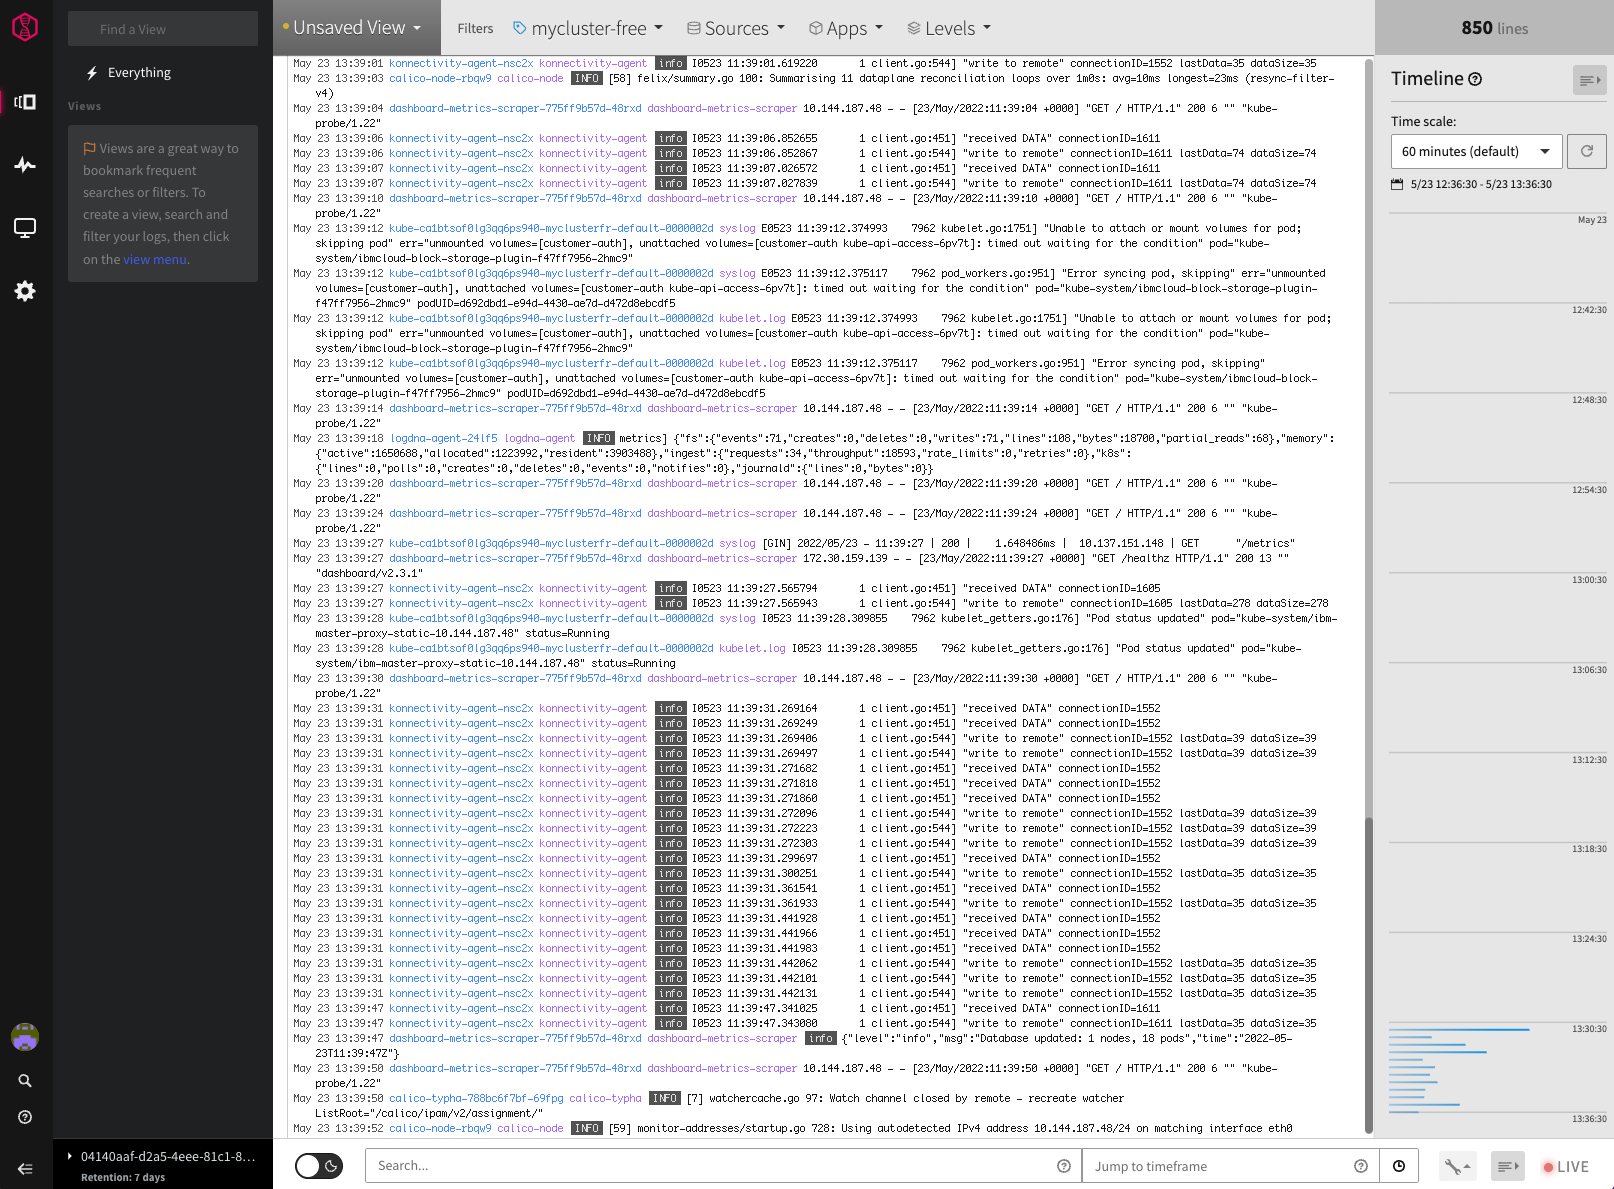
After creating the logging instance you can open the Log analysis dashboard by clicking “Launch” on the cluster overview page
Connect to a monitoring service
-
On the cluster overview page, connect your cluster with a monitoring service through the tile called “Integrations”
-
Create a new monitoring service instance in Frankfurt using the Free plan
-
After creating the logging instance you can open the Log analysis dashboard by clicking “Launch” on the cluster overview page

-
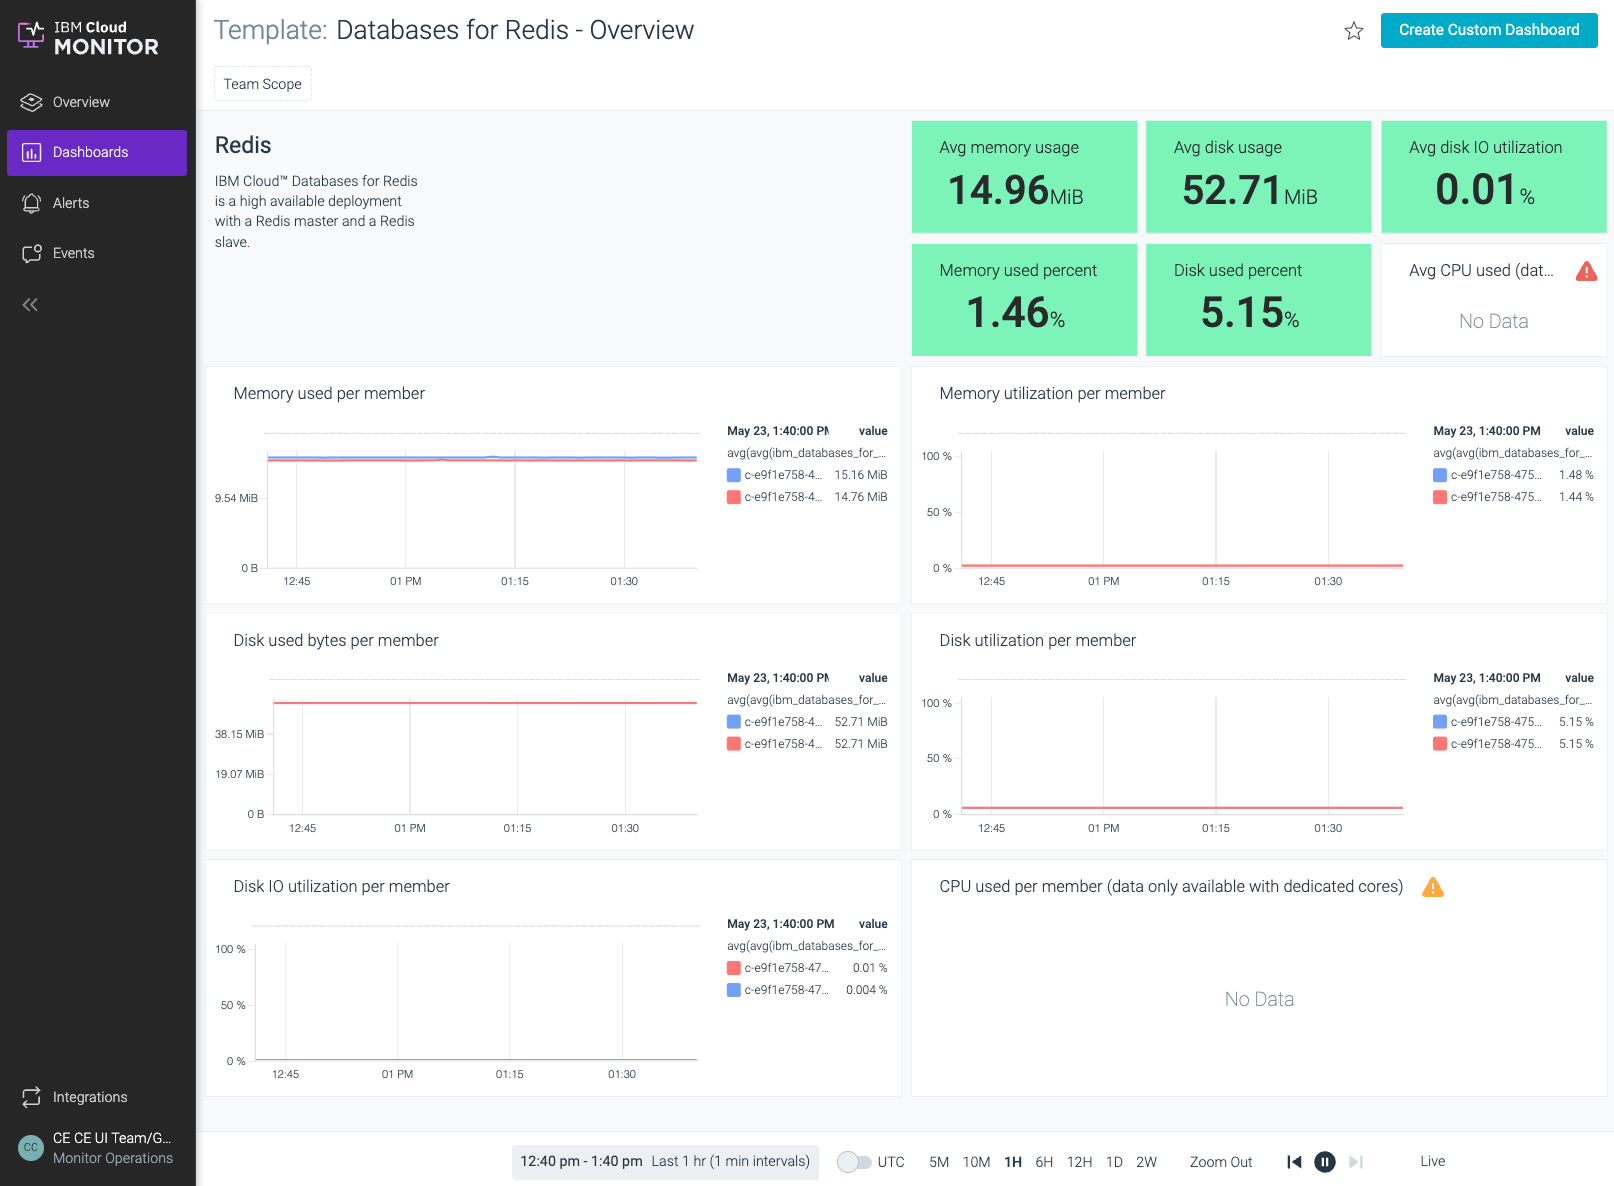
Note: It will take some time until the dashboard will show meaningful data
-
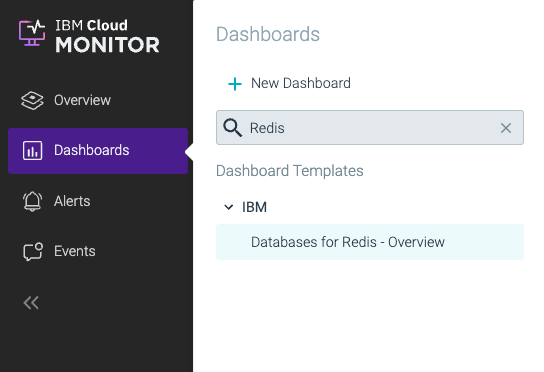
In the “Dashboards” Menu search for “Redis” and select “Databases for Redis”
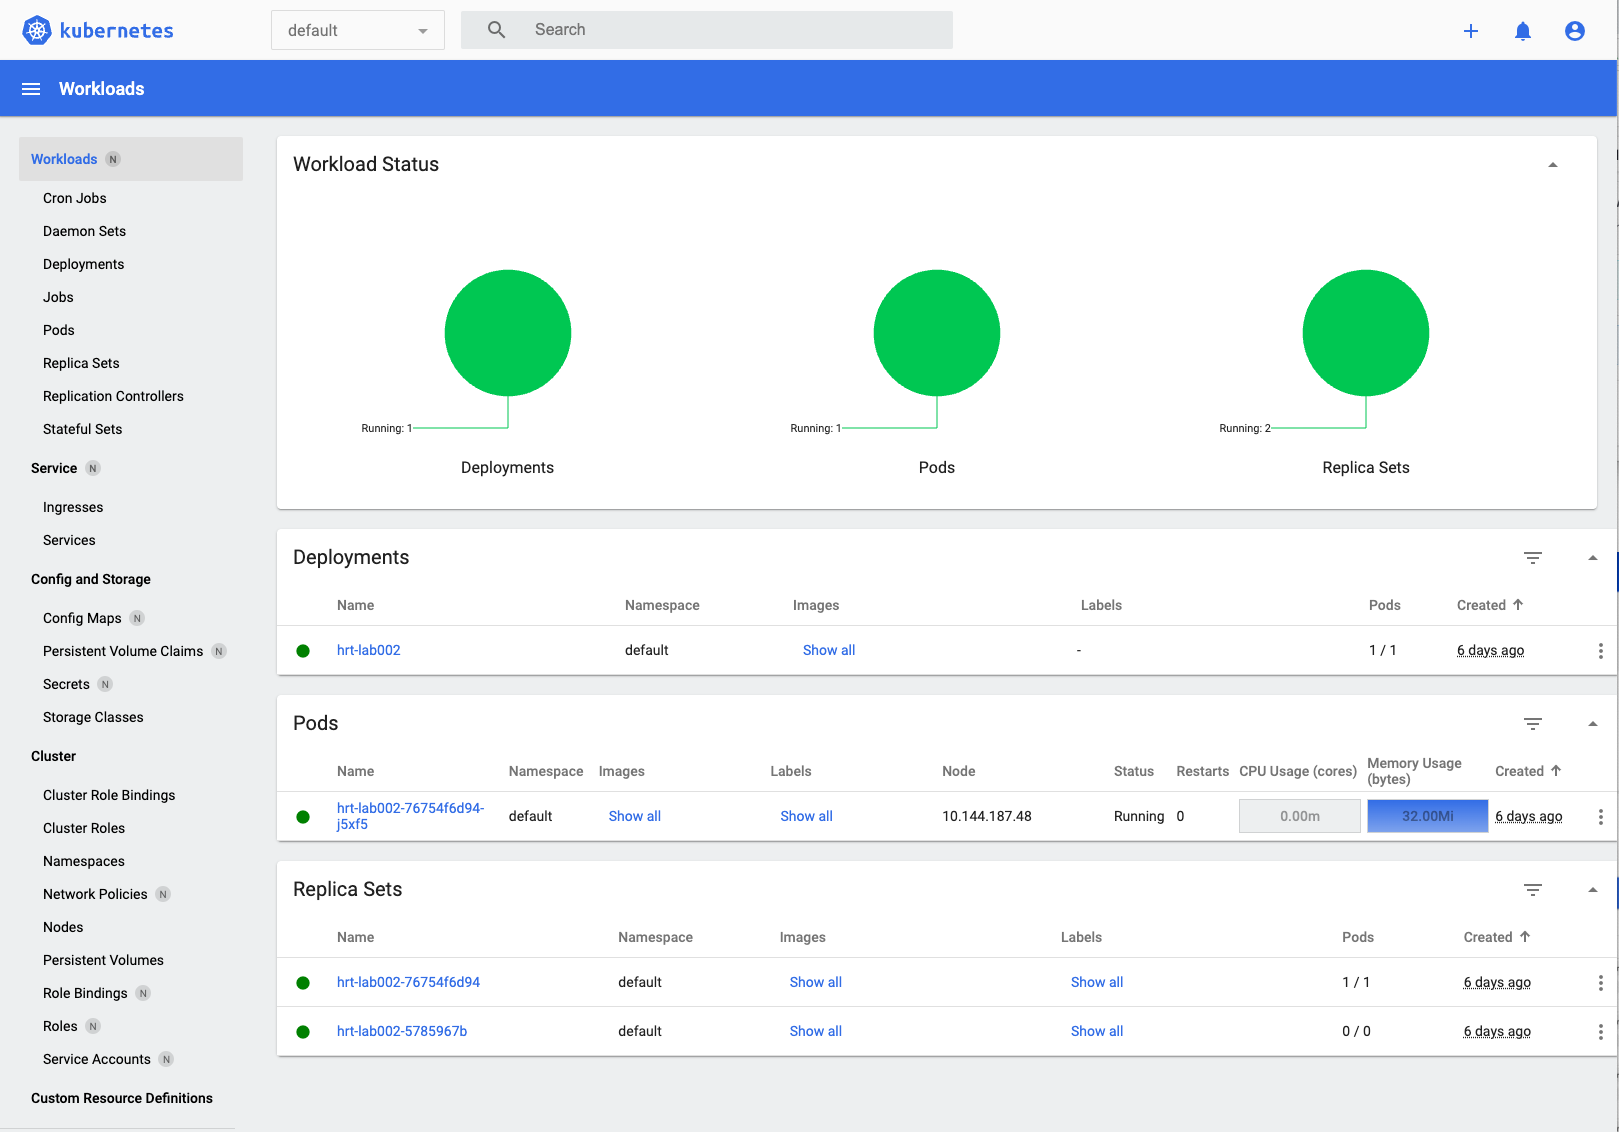
Open the Kubernetes dashboard
-
On the cluster overview page, click the “Kubernetes dashboard” button to open the Kubernetes dashboard
-
Kubernetes Dashboard is a general purpose, web-based UI for Kubernetes clusters. It allows users to manage applications running in the cluster and troubleshoot them, as well as manage the cluster itself.